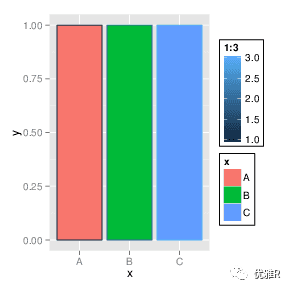
本来是一个这样的图形

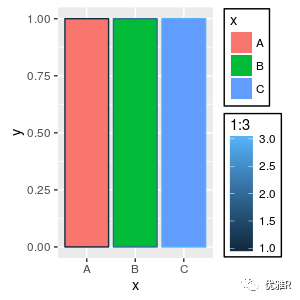
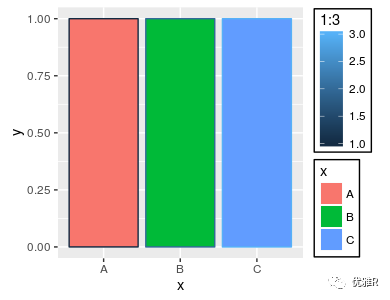
新版本变成了

而我是画两个相似的图形时出现这问题,数据结构一样,然后画图后图例的顺序变了~
根据文档,默认使用了某种“秘密魔法”?!
order: positive integer less that 99 that specifies the order of this guide among multiple guides. This controls the order in which multiple guides are displayed, not the contents of the guide itself. If 0 (default), the order is determined by a secret algorithm.
解决办法是有的,我们可以使用order选项设定。下面是一个例子:
代码语言:javascript
复制
dat <- data.frame(x = LETTERS[1:3], y = 1) p <- ggplot(dat, aes(x, y, fill = x, colour = 1:3)) + geom_bar(stat = "identity") + theme(legend.background = element_rect(colour = "black")) # These two are the same p + guides( color = guide_colorbar(order = 0), fill = guide_legend(order = 0) ) p + guides( color = guide_colorbar(order = 0), fill = guide_legend(order = 1) )

如果我们要改变图例顺序,按下面的操作,将color变成1,然后fill使用默认排序:
代码语言:javascript
复制
# And we can reverse the order p + guides( color = guide_colorbar(order = 1), fill = guide_legend(order = 0) )

当然,如果你理解了上面的英文文档,怎么设定怎么排都是可以的。